Cilium is a networking, observability, and security platform based on eBPF. As a CNI, it provides a flat Layer 3 network, even across clusters....
Cilium is a networking, observability, and security platform based on eBPF. As a CNI, it provides a flat Layer 3 network, even across clusters....
eCHO news 103
Cilium is a networking, observability, and security platform based on eBPF. As a CNI, it provides a flat Layer 3 network, even across clusters....
eCHO news 104
Cilium is a networking, observability, and security platform based on eBPF. As a CNI, it provides a flat Layer 3 network, even across clusters....
eCHO news 105
Cilium is a networking, observability, and security platform based on eBPF. As a CNI, it provides a flat Layer 3 network, even across clusters....
eCHO news 106
Cilium is a networking, observability, and security platform based on eBPF. As a CNI, it provides a flat Layer 3 network, even across clusters....
eCHO news 107
Cilium is a networking, observability, and security platform based on eBPF. As a CNI, it provides a flat Layer 3 network, even across clusters....
eCHO news 108
Cilium is a networking, observability, and security platform based on eBPF. As a CNI, it provides a flat Layer 3 network, even across clusters....
eCHO news 109
Cilium is a networking, observability, and security platform based on eBPF. As a CNI, it provides a flat Layer 3 network, even across clusters....
eCHO news 110
Kubernetes is an open-source system for automating deployment, scaling, and management of containerized applications
Open source maintainership in the age of AI
AI has really changed the game around software development. More people are leveraging AI than ever to contribute patches to projects they use. To me, this is a good thing as more folks will contribute patches rather than fork or not fix them. The main problem is that AI has made generating code fast but there has been very little improvement in maintaining code bases. In this post, we will highlight the ways the Kubernetes community is adapting to the world of AI assisted coding.
The
fluent-package v6.0.4 has been released
Hi users!
We have released fluent-package v6.0.4 on 2026-06-26. Fluent Package is a stable distribution package of Fluentd. (successor of td-agent)
This is a maintenance release of v6.0.x LTS series.
This release fixes some vulnerabilities which were resolved in Fluentd v1.19.3.
As fluentd will be deployed to internal/trusted networks usually, so they will not affect you,
but we recommend to upgrade to v6.0.4.
Fluent Package v6.0.4
Fluent Package v6.0.4 includes the following improvements:
- Updated bundled Fluentd to v1.19.3 which fixes some vulnerabilities.
This article explains the changes in Fluent Package v6.0.4.
Changes
Updated bundled Fluentd to v1.19.3 which fixes some vulnerabilities.
In this release, some critical vulnerabilities were fixed.
- Remote Code Execution (RCE) via Arbitrary File Write in
${tag}Placeholder- CVE-2026-44024
- CVSS v3 score: 9.8/10 (Critical)
- Workarounds: Restrict network access, run as non-root user, use
shared_keyfor authentication, filter incoming untrusted tags.
- Exposure of Sensitive Information via Monitor Agent API
- CVE-2026-44025
- CVSS v3 score: 7.5/10 (High)
- Workarounds: Restrict network access for
in_monitor_agent, allow connection from only localhost.
- Denial of Service (DoS) via Gzip Decompression Bomb in
in_httpandin_forward- CVE-2026-44160
- CVSS v3 score: 7.5/10 (High)
- Workarounds: Restrict network access for
in_forwardorin_http, useshared_keyfor authentication which allow trusted incoming source.
- Server-Side Request Forgery (SSRF) via out_http Placeholder Expansion
- CVE-2026-44161
- CVSS v3 score: 7.2/10 (High)
- Workarounds: Avoid usage of dynamic hostname in placeholder, restrict network access from untrusted network, use only allowed hosts.
- Denial of Service (DoS) via Large Payloads and Decompression Bombs in
in_opentelemetry- CVE-2026-44162
- CVSS v3 score: 5.3/10 (Moderate)
- Workarounds: Restrict network access for
in_opentelemetry, use a robust reverse proxy in front of Fluentd to mitigate GZIP decompression bomb.
- Denial of Service (DoS) via Decompression Bomb in
in_s3- CVE-2026-44163
- CVSS v3 score: 2.7/10 (Low)
- Workarounds: Ensure that write (PUT) access to the S3 bucket monitored by
in_s3is strictly limited to trusted services and administrators.
The above vulnerabilities affects to older than v1.19.3, thus the following packages also will be affected.
- fluent-package LTS v6.0.3 or earlier
- fluent-package Standard edition v6.0.0 (NOTE: no patched version planned yet, please consider to use LTS)
- fluent-package LTS v5.0.9 or earlier (NOTE: v5.0.x already reached EOL, no patched updates anymore)
- fluent-package Standard edition v5.2.0 or earlier (NOTE: v5.x already reached EOL, no patched updates anymore)
- All of td-agent (NOTE: td-agent already reached EOL, no patched updates anymore)
We recommend upgrading fluent-package to v6.0.4.
If you can't upgrade it immediately, there is a case that mitigation method is explained in above advisory. Please check each advisory and take care of it.
Download
Please visit the download page.
Announcement
About next LTS schedule
We plan to release the next LTS version of fluent-package v6.0.5 at Sep 2026. The content of updates are still TBD.
Follow us on X
We have been posting information about Fluentd in Japanese on @fluentd_jp. We would appreciate it if you followed the X account.
Kubernetes is an open-source system for automating deployment, scaling, and management of containerized applications
Introducing the Cluster API plugin for Headlamp
Headlamp is an open-source, extensible Kubernetes SIG UI project designed to let you explore, manage, and debug cluster resources directly from a browser.
Cluster API (CAPI) is a Kubernetes sub-project that brings declarative, Kubernetes-style APIs to cluster lifecycle management. It lets platform teams provision, upgrade, and manage the lifecycle of Kubernetes clusters using standard Kubernetes objects s
Kubernetes is an open-source system for automating deployment, scaling, and management of containerized applications
Inspect Volcano workloads faster with Headlamp
Volcano is a cloud native batch scheduler for Kubernetes, built for high-performance computing, AI/ML, and other batch workloads.
Headlamp is an extensible Kubernetes web UI. With its plugin system, Headlamp can surface APIs and workflows beyond the built-in Kubernetes resources. The Volcano plugin brings core Volcano resources into Headlamp so you can inspect workload state, queue behavior, and gang scheduling detai
Kubernetes is an open-source system for automating deployment, scaling, and management of containerized applications
See your serverless: introducing the Headlamp plugin for Knative
Headlamp is an open-source, extensible Kubernetes SIG UI project designed to let you explore, manage, and debug cluster resources.
Knative brings serverless workloads to Kubernetes, handling traffic routing, autoscaling, and revision management so teams can deploy and iterate without fighting infrastructure. But operating Knative workloads day-to-day can be difficult, there's still a lot of jumping between the
Delivers efficient, stable, and secure data distribution and acceleration powered by P2P technology, with an optional content‑addressable filesystem that accelerates OCI container launch.
Dragonfly v2.5.0 has been released
Dragonfly v2.5.0 is released!🎉🎉🎉 Thanks to the contributors who made this release happen and welcome you to visit d7y.io website.

New features and enhancements
Direct Repository Downloads from Hugging Face and ModelScope
Dragonfly Client now supports directly downloading model repositories from Hugging Face and ModelScope. Users can run commands such as dfget hf://deepseek-ai/DeepSeek-OCR and dfget modelscope://models/deepseek-ai/DeepSeek-OCR to fetch repositories.
Git LFS data is downloaded through Dragonfly P2P acceleration, while other repository metadata is fetched through the Git protocol.
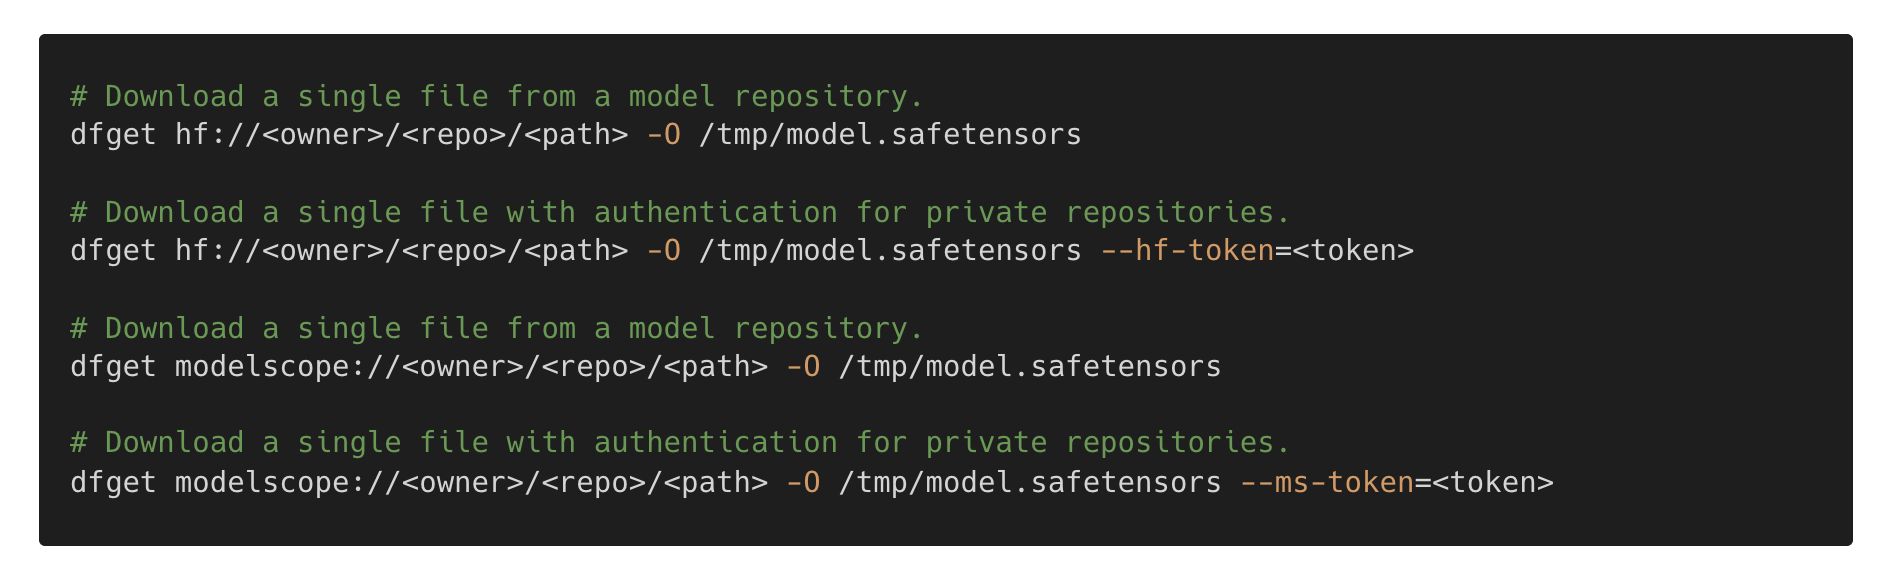
For more information, please refer to Hugging Face repository download and ModelScope repository download.
Dragonfly Injector for Kubernetes Webhook Injection
Dragonfly provides dragonfly-injector, a Kubernetes Mutating Admission Webhook for automatic P2P capability injection. It can inject Dragonfly client binaries and configurations, dfdaemon socket mounts, and CLI tools into application Pods through annotation-based policies, enabling Pods to use Dragonfly for file downloads without rebuilding container images. Helm Charts now also support deploying Dragonfly with webhook injection enabled.
For more details, please refer to Using Dragonfly with webhook injection.
Blocklist for Download Control
Dragonfly supports configuring a blocklist in the Manager console to disable specific downloads.
This can be used as an emergency measure to mitigate the impact of sudden abnormal requests on the service.
When a blocked download is intercepted, gRPC downloads return a PermissionDenied error code, and HTTP proxy downloads return a FORBIDDEN status.
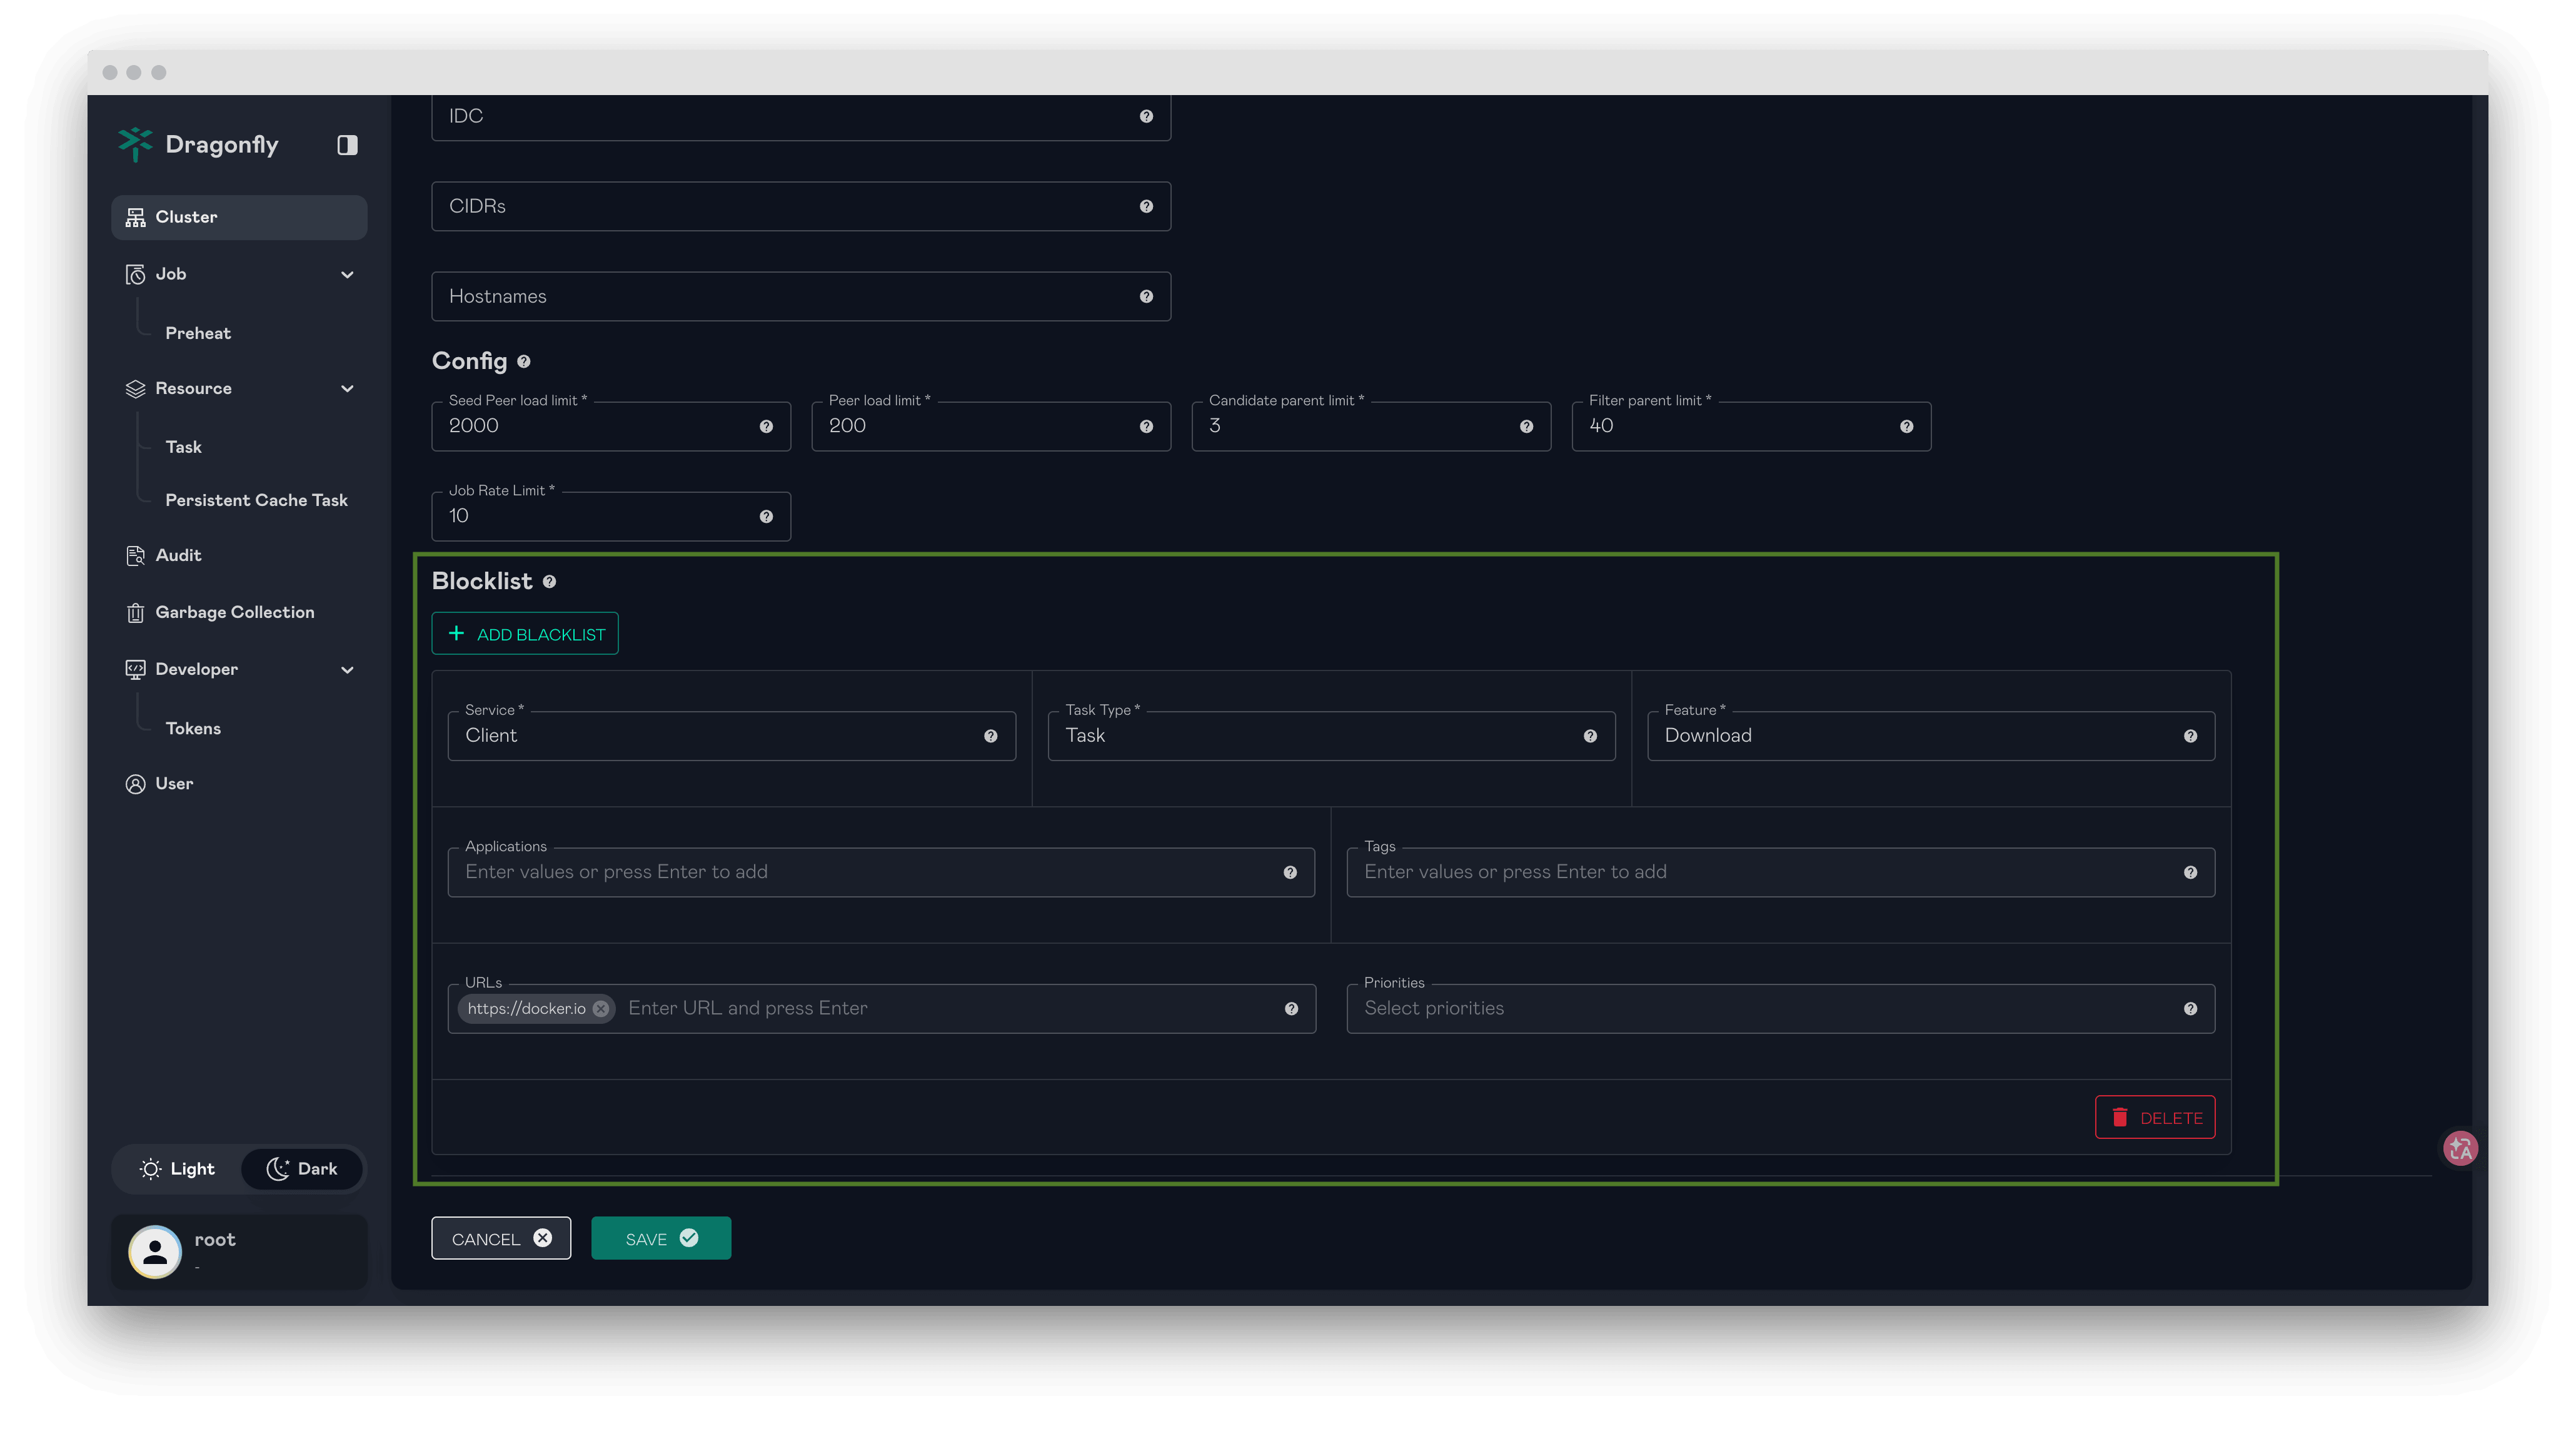
For more information, please refer to Blocklist.
Comprehensive Rate Limiting
Dragonfly introduces more complete rate limiting capabilities across the control plane and client. Manager and Scheduler gRPC servers now support a configurable request rate limit for unary requests and streaming connections. The client supports outbound bandwidth, inbound bandwidth, back-to-source bandwidth, prefetch bandwidth, upload request, download request, and adaptive rate limiting to better protect source services and improve system stability under high load.
For more information, please refer to Rate Limit.
dfctl Command Line Tool
Dragonfly Client introduces dfctl, a command-line tool used to manage tasks in the client's local storage, including tasks, persistent tasks, and persistent cache tasks.
It supports listing and removing local resources, and can preheat file and image tasks through the Scheduler.
For more information, please refer to dfctl.
Container Registry Proxy Configuration Simplification
dfdaemon can now infer the upstream registry from the ns query parameter appended by containerd registry mirror requests.
Combined with proxyAllRegistries: true, users can route all registries through Dragonfly with a single _default/hosts.toml configuration instead of maintaining separate registry-specific hosts.toml files and X-Dragonfly-Registry headers.
For more information, please refer to Infer upstream registry from containerd ns query parameter and proxyAllRegistries documentation update.
Client Download and Transfer Optimization
Dragonfly Client improves download efficiency and file transfer reliability in multiple areas. The parent selector and piece collector now coordinate more closely to collect enough parent peers before scheduling decisions, improving bandwidth utilization while keeping graceful fallback for unstable parent peers. File export and download operations now use buffered writes, and gRPC stream buffer sizes and connection settings have been tuned for better large-file transfer performance.
HTTP Handling and Redirect Security Improvements
The HTTP backend now uses HTTP/1.1 and improves stat request handling by retrying with a HEAD request when a response has Transfer-Encoding but no Content-Length.
Dragonfly also strips sensitive headers such as Authorization and Cookie when following cross-origin redirects, and avoids caching relative HTTP 307 redirect locations while still resolving them correctly during request processing.
Additional Enhancements
- Add ExternalRedis TLS support in Manager, including CA certificate, client certificate, key, and
insecureSkipVerifyoptions. - Remove deprecated V1 preheat API endpoints and consolidate health checks to the
/healthyendpoint. - Improve upload and download metrics collection and remove unused gRPC piece download logic.
- Improve
INSTANCE_NAMEgeneration by using Kubernetes build-time environment variables and falling back to the system hostname. - Add dfdaemon
hickory_dnsoptions to make DNS resolver behavior configurable. - Improve task ID calculation for OCI registry blob downloads to reduce redundant downloads and storage across registries.
Significant bug fixes
- Fixed the Redis Lua script argument order for peer TTL and
concurrent_piece_count, preventing unintended key expiration and incorrect peer state. - Fixed PostgreSQL
SERIALsequence handling after seeding default Scheduler Cluster and Seed Peer Cluster records, avoiding primary key conflicts when creating new clusters. - Fixed relative HTTP 307 redirect handling by skipping cache for relative
Locationvalues and resolving them against the base URL before following redirects.
Nydus
New features and enhancements
- Support building prefetch-optimized layer blobs for Ondemand data.
- Support converting Nydus images to OCI format and converting to/from local archives.
- Support zero-disk transfer in Nydusify Copy.
- Introduce uffd-based support for the virtio-pmem DAX backend to enable high-performance on-demand image loading in Kata scenarios.
- Support switching the Storage layer from Proxy mode to Dragonfly SDK mode to improve P2P cache hit performance.
- Support committing with short container IDs and synchronizing the filesystem before commit.
- Support resending FUSE requests when recovering Nydusd, fixing hot-upgrade tests.
Significant bug fixes
- Fix Blobfs compatibility with fuse-backend-rs 0.12.0.
- Fix failover-policy parameter parsing.
- Fix a panic in Builder when a symbolic link overwrites a directory.
- Fix multiple issues in chunkdict deduplication logic, DBSCAN clustering, and chunk sorting.
- Fix Nydus image detection logic.
- Fix remount invalidation for nested mount points in fusedev.
- Fix abnormal values when Nydusctl backend metric counters are reset.
- Fix Nydusify failing to find blobs when image names are modified.
- Fix plain HTTP conversion in Nydusify.
Others
You can see CHANGELOG for more details.
Links
- Dragonfly Website: https://d7y.io/
- Dragonfly Repository: https://github.com/dragonflyoss/dragonfly
- Dragonfly Client Repository: https://github.com/dragonflyoss/client
- Dragonfly Injector Repository: https://github.com/dragonflyoss/dragonfly-injector
- Dragonfly Console Repository: https://github.com/dragonflyoss/console
- Dragonfly Charts Repository: https://github.com/dragonflyoss/helm-charts
- Dragonfly Monitor Repository: https://github.com/dragonflyoss/monitoring
Dragonfly Github
Fluentd v1.19.3 has been released
Hi users!
We have released v1.19.3 on 2026-06-25. ChangeLog is here.
This release is a maintenance release of v1.19 series.
This release is bundled for fluent-package LTS version v6.0.4!
Security Fixes
Many vulnerabilities were fixed in this release.
- Remote Code Execution (RCE) via Arbitrary File Write in
${tag}Placeholder- CVE-2026-44024
- CVSS v3 score: 9.8/10 (Critical)
- Workarounds: Restrict network access, run as non-root user, use
shared_keyfor authentication, filter incoming untrusted tags.
Exposure of Sensitive Information via Monitor Agent API
- CVE-2026-44025
- CVSS v3 score: 7.5/10 (High)
- Workarounds: Restrict network access for
in_monitor_agent, allow connection from only localhost. - Breaking changes: If you dare to keep previous non-secure behavior, need tweak
include_config,include_retryandinclude_debug_infoparameters.
<source>
  @type monitor_agent
  include_config true     # since v1.19.3, changed to false by default
  include_retry true      # since v1.19.3, newly introduced, false by default
  include_debug_info true # since v1.19.3, newly introduced, false by default
  ...
</source>
Denial of Service (DoS) via Gzip Decompression Bomb in
in_httpandin_forward- CVE-2026-44160
- CVSS v3 score: 7.5/10 (High)
- Workarounds: Restrict network access for
in_forwardorin_http, useshared_keyfor authentication which allow trusted incoming source.
Server-Side Request Forgery (SSRF) via out_http Placeholder Expansion
- CVE-2026-44161
- CVSS v3 score: 7.2/10 (High)
- Workarounds: Avoid usage of dynamic hostname in placeholder, restrict network access from untrusted network, use only allowed hosts.
Additionally, similar vulnerability was also fixed in the following fluentd plugins:
- fluent-plugin-s3 DoS via Gzip decompression vulnerability was fixed in 1.8.5
- fluent-plugin-opentelemetry DoS via Gzip decompression vulnerability was fixed in 0.5.3
In most cases, there is no problem using deployed Fluentd within a closed, trusted network. If you could not update Fluentd immediately, consider to take advised mitigation in above advisories.
Bug Fixes
Many bugs were also fixed in this release.
in_debug_agent: accept only from local machine by default- buffer: resume buffer correctly even though path contains []
out_forward: avoid reusing closed keepalive sockets after remotestorage_local: fix encoding error when fix encoding error when reading non-ASCII characters
in_debug_agent: accept only from local machine by default
Historically, in_debug_agent accepts remote access by default.
This behavior is not problem because usually in_debug_agent must be
explicitly enabled by users who know what you do.
But, there is an security concern which accepts external access by default even though user must enable it explicitly.
To mitigate security concern, changed that behavior a bit secure by default.
If you dare to keep previous non-secure behavior, specify 0.0.0.0 explicitly.
<source>
  @type monitor_agent
  bind 0.0.0.0   # prior to v1.19.3 default behavior
  bind 127.0.0.1 # since v1.19.3 default behavior
  ...
</source>
buffer: resume buffer correctly even though path contains []
If buffer path contains [] in tag something like "path test/${tag[0]}", when
resuming buffer process can't find them without escaping bracket.
Thus buffer files remains under that directory.
In this release, that can be resumed correctly.
Note that recommended tag spec is specified in routing documentation, but
it is easily shoot your legs in practical use-case if you use [] characters.
so it is changed to take care of that case.
avoid reusing closed keepalive sockets after remote disconnects
In the previous versions, there was a keepalive socket reuse bug.
When a cached keepalive connection has already been closed by the remote side,
out_forward could pick that socket back up and try to write to it again.
As a result, that left the flush thread spinning on a dead socket and can drive CPU usage to 100%.
storage_local: fix encoding error when fix encoding error when reading non-ASCII characters
If data containing non-latin characters are stored onto disk using the
storage_local plugin, the file is properly written but cannot be read
again once fluentd restarts. Now that behaviour was fixed by properly
handling the file encoding.
Improvements
In this release, added some warnings for problematic use-cases.
- warn recommended exclusion path for antivirus
- buffer: warn if default timekey (1d) will be used
- output windows: check shorter service timeout on shutdown
If there are any potential issues with your configuration, Fluentd detects above cases additionally.
Enjoy logging!
Follow us on X
We have been posting information about Fluentd in Japanese on @fluentd_jp. We would appreciate it if you followed the X account.
Kubernetes is an open-source system for automating deployment, scaling, and management of containerized applications
Spotlight on WG Device Management
The rising popularity of AI, Edge, and Telecommunications workloads on Kubernetes has led to new requirements for hardware management. We now need hardware specification beyond CPU time and memory allocations. This includes allocating GPUs, TPUs, network interfaces, and other hardware, sometimes after pod start and occasionally through time-sharing.
Efficiently managing this specialized hardware is the mission of the
Enabling built-in observability for cloud-native systems.
Don't Wrap OpenTelemetry — You're Probably Hurting More Than Helping
There’s a pattern I’ve seen across many teams adopting OpenTelemetry, and it’s
well-intentioned every single time. An engineer wants to make things easier for
the team. They build a thin abstraction over the OTel API — an IMetric
interface, a TelemetryHelper class, a MetricsWrapper module — and ship it as
the team’s standard. “Just use this,” they say. “It’s simpler.”
The intention is genuine.
Ultra light, ultra simple, ultra powerful. Linkerd adds security, observability, and reliability to Kubernetes, without the complexity.
Federating Clusters for Zero-Downtime Kubernetes
Every multi-region setup eventually meets the same awkward moment: a whole cluster goes away, and the identical copy of your service running two regions over might as well not exist, because nothing is wired to treat them as one thing. Failover becomes a runbook: restore, repoint DNS, and wait for an outage that, on paper, you’d already paid to survive.
Linkerd’s multicluster extension closes that gap by letting several clusters present a service as a single, load-balanced
Crossplane is the cloud native control plane framework that allows you to build control planes without needing to write code. Crossplane has a highly extensible backend that enables you to orchestrate applications and infrastructure no matter where they run and a highly configurable frontend that lets you define the declarative API it offers.
Building Modelplane on Crossplane

I've worked on Crossplane for almost eight years, since the v0.1 release. In that time I've watched a lot of people use it to put cloud infrastructure behind an API. For the last few months I've been using it to put a particular, demanding kind of infrastructure behind an API: a fleet of GPUs running model inference.
The project is called Modelplane. It lets a platform team turn a pile of accelerators (across clouds, neoclouds, and on-premise) into one fleet. It also lets the ML teams they support deploy a model and get a stable, OpenAI-compatible endpoint without thinking about where it runs.
Modelplane exists because open-weight models have moved inference out of the labs and hyperscalers and into everyone else: neoclouds, regulated enterprises keeping models inside their own walls, and companies trying to get their inference bills under control. The open source stack for serving a model on a single cluster is strong now: vLLM, SGLang, KEDA, Gateway API, DRA. But inference almost never stays in one cluster. Capacity is scattered across hardware types, providers, and regions. The hard problems are now above the cluster: placing models across the capacity you have, provisioning more, routing by cost and locality, moving weights around. The labs and the hyperscalers all built systems to do this, but they built them privately. That's the gap Modelplane fills: an open control plane that sits above your clusters and operates them as one inference fleet.
If the inference part interests you, the Modelplane docs and Bassam's introduction are the place to go. This post is for the Crossplane crowd, because the part I think you'll find interesting is that Modelplane is, top to bottom, a Crossplane configuration. It has no bespoke controllers and no custom operators: it's compositions and composition functions. The same primitives you could use to compose an RDS instance, pushed a lot harder.
I want to cover the problem we set out to solve with Crossplane, the parts of the framework we leaned on hardest, and the edges we hit and fixed upstream.
The problem, in Crossplane terms
Strip away the inference vocabulary and Modelplane's job is one Crossplane users will recognize: take a declarative description of what someone wants, and turn it into composed infrastructure spanning cloud accounts, many Kubernetes clusters, and the workloads on them. Provision an EKS or GKE cluster with the right GPUs. Install an inference stack onto it. Decide which cluster each model runs on, and how many copies. Keep it all converged as clusters come and go and people's inference needs change.
Crossplane was built for that shape of problem. Providers gave us reach: we provision clusters and the infrastructure they need across different clouds, and install software onto them, without needing to write new controllers. Functions allowed us to focus on our business logic, the placement and the scheduling. We didn't have to write the controller plumbing by hand: the watches and requeues and finalizers and drift correction that Crossplane core already handles.
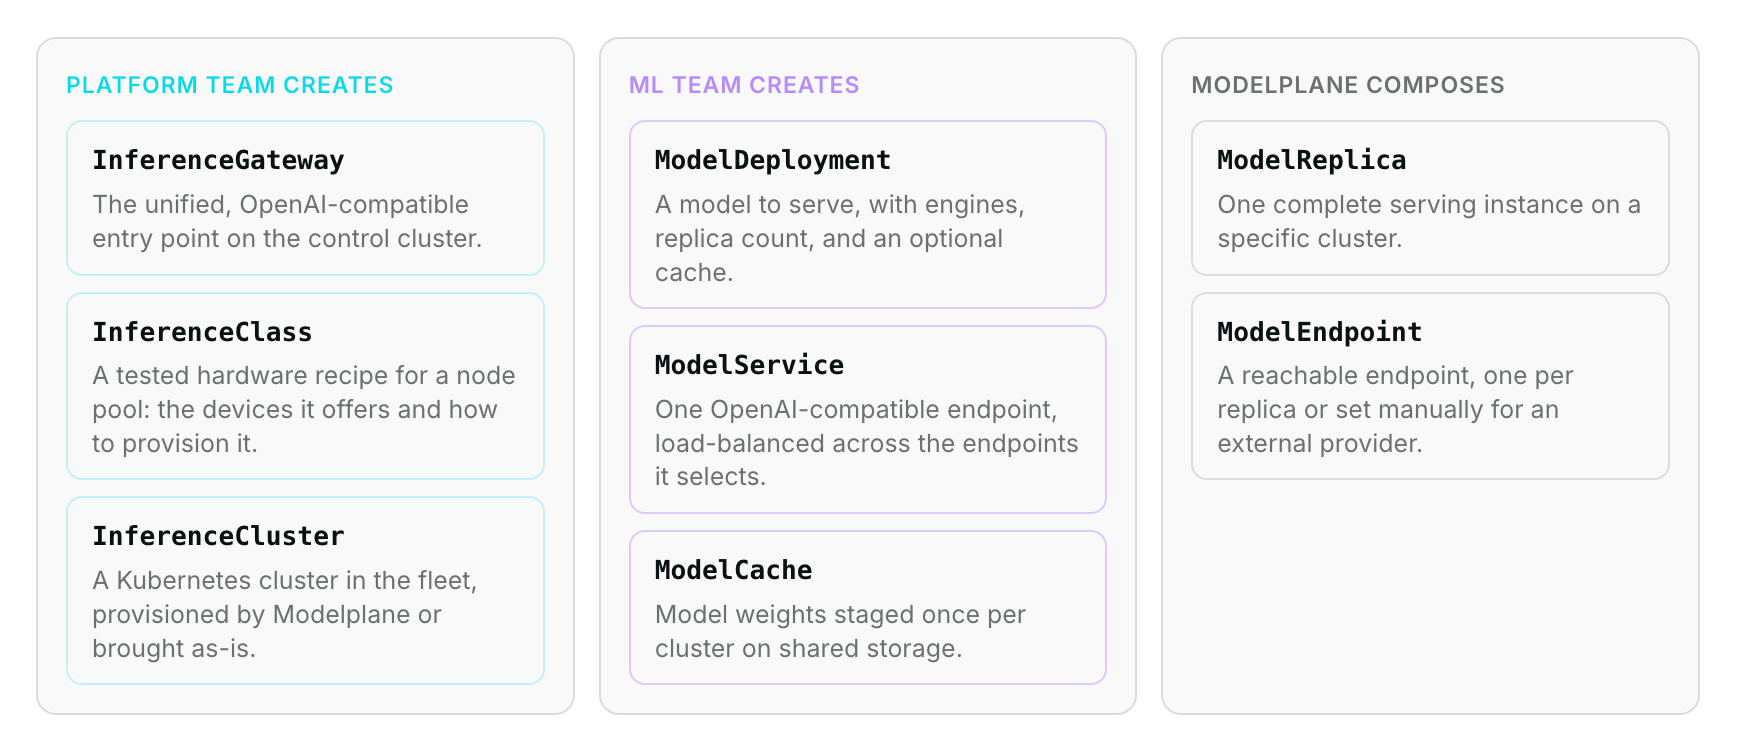
Crossplane v2 helped here too. Modelplane has two clear personas. Platform teams describe the fleet. ML teams describe a model. That split maps onto a scope boundary: an InferenceCluster or InferenceClass is cluster-scoped, a ModelDeployment or ModelService is a plain namespaced composite resource the ML team owns. v2 namespaced composites let us express that directly, with no claim-and-XR duality to explain. That's useful, but it isn't what made the project buildable.
What made it buildable: Developer experience
What really unlocked this project was the new Crossplane CLI and the schemas it generates.
Modelplane's functions are all written in Python. We chose Python because it's the lingua franca of the ML world. We hope it might help folks who aren't yet cloud native experts contribute to the project. Writing functions in Python used to mean giving up a lot of the tooling that makes a codebase feel like a proper project. The new crossplane CLI changed that. It scaffolds a project, generates an XRD from an example resource, and generates typed schema bindings for your APIs.
Those generated models changed how we worked. Our functions read and write typed objects instead of poking at untyped dictionaries and hoping the field is spelled the way we remember. A typo or a wrong type now fails at author time. The models also sped up the coding agents we leaned on while building. A generated type tells the agent the exact shape, so it got field names and types right the first time.
There was friction. We outgrew the CLI's built-in function builders early, and we needed schema generation for one language, not all four. Both of those turned into upstream contributions, which I'll come back to.
Designing the API
The hardest part of Modelplane was designing the API.
People come up to me at conferences worried about how they'll make breaking changes to the APIs they build with Crossplane. My answer is usually that you almost never have to, if you really think the API through before you release it. That discipline pays off: reach for arrays and enums before you think you need them, use required fields sparingly, and leave room to grow without a breaking change.
Take the ModelDeployment, arguably Modelplane's most important API. It's how an ML team describes a model to serve: its engines, what their pods need from a node, and how many replicas to run across the fleet.
apiVersion: modelplane.ai/v1alpha1
kind: ModelDeployment
metadata:
  name: qwen3-8b
  namespace: ml-team
spec:
  replicas: 1
  engines:
  - name: qwen3-8b
    members:
    - role: Standalone
      nodeSelector:
        devices:
        - name: gpu
          count: 1
          selectors:
          - cel: device.capacity["gpu.nvidia.com"].memory.compareTo(quantity("20Gi")) >= 0
      template:
        spec:
          containers:
          - name: engine
            image: vllm/vllm-openai:v0.23.0
            args:
            - "--model=Qwen/Qwen3-8B"
            - "--served-model-name=qwen"
            # ... engine flags omitted for brevity
I got the engines array wrong at first, and only caught it about two weeks before we released v0.1. Until then a ModelDeployment had a spec.topology block where you'd write tensor: 8 and pipeline: 2. Modelplane would derive engine-specific flags like --tensor-parallel-size and inject them. The problem was that this coupled Modelplane to engine specifics. We could only run the engines whose flags we knew how to inject. It also couldn't express the data and expert parallelism we knew was coming. I caught it only because I sat down to write worked examples for those topologies and found I couldn't. I replaced it with shape: an engine is an array of Standalone, Leader, or Worker members, and the parallelism lives entirely in the flags the user writes. My takeaway: don't rush API design. Work through it with your users and peers, let it sit if you can, and write enough worked examples to confirm you can model everything they need before you commit.
The functions do the work
One thing I really like about composition functions is that they scale with your problem. At the low end a function is a few Go templates or some KCL inlined in the Composition. At the high end it's a program that can do almost anything a traditional Go operator can. Python rides that whole range too, and Modelplane is what the far end looks like once the problem grows.
Modelplane's business logic is all composition functions. Scheduling is an interesting example. I'll walk through it because it shows how far a composition function can be pushed.
Modelplane runs a fleet scheduler in the control plane. Each cluster in the fleet is an InferenceCluster, and each of its node pools references an InferenceClass that declares the pool's hardware. When an ML team creates a ModelDeployment, the fleet scheduler places each replica against that declared node pool capacity, before any nodes necessarily exist. That's a different job from in-cluster DRA, which is a runtime allocator: its drivers publish ResourceSlices about real hardware on real nodes.
Scheduling happens in two layers. The fleet scheduler picks the cluster and node pool; the cluster's own in-cluster scheduler and DRA then place pods on nodes and bind GPUs. That in-cluster scheduler is good at its layer (a single cluster supports up to 5,000 nodes), but a fleet isn't one cluster. It can't be: a cluster doesn't span clouds, and you wouldn't want one blast radius over your whole accelerator footprint even if it could.
Modelplane borrows DRA's vocabulary and lifts it to the fleet layer. DRA's typed, domain-prefixed attribute model and CEL predicate language are a good fit, and they express cleanly in OpenAPI. A platform team's InferenceClass declares what a pool's hardware offers, the same shape DRA uses to describe a real device:
devices:
- name: gpu
  claim: DRA
  driver: gpu.nvidia.com
  deviceClassName: gpu.nvidia.com
  attributes:
    architecture: { string: Ada Lovelace }
  capacity:
    memory: { value: "23034Mi" } # the L4's real usable VRAM
A deployment's nodeSelector then asks for what it needs with a CEL expression:
selectors:
- cel: device.capacity["gpu.nvidia.com"].memory.compareTo(quantity("20Gi")) >= 0
Our scheduler evaluates that CEL against an InferenceClass's declared attributes, and DRA evaluates the same expression against a real GPU when the pod binds. The same expression runs at both levels.
A composition function is, by design, a pure function of its inputs. Crossplane hands it the observed composite, and the function returns the desired children. Our scheduler is exactly that, a pure function of observed state, which is what makes it safe to run on every reconcile. A scheduler can't decide placement from the deployment alone, though. It has to see the whole fleet: every InferenceCluster and its published capacity, and every ModelReplica that already exists, including those of other deployments, so it can account for capacity they've already consumed.
That's require_resources (what some of you will know as extra resources), and we couldn't have built the scheduler without it. The function asks Crossplane for the resources it needs to reason over, and Crossplane fetches them and calls the function again with them in hand:
# Every InferenceCluster: candidate clusters with their declared capacity.
response.require_resources(
 rsp, name="clusters",
 api_version="modelplane.ai/v1alpha1", kind="InferenceCluster",
 match_labels=clusters_match_labels,
)
# Every ModelReplica across all deployments: capacity already in use.
response.require_resources(
 rsp, name="all-replicas",
 api_version="modelplane.ai/v1alpha1", kind="ModelReplica",
)
That second call, asking for every resource of a kind with no name or label filter, is one of the things we had to fix upstream.
Where Modelplane pushed Crossplane, and we fixed it upstream
Build something this demanding on Crossplane and you find its rough spots. Modelplane found several. Rather than work around them, we sent fixes upstream, so your configurations get the benefit too.
The first thing we hit was the build itself. The CLI's built-in function builders are great until you outgrow them, and we needed to coordinate function builds with Nix, the rest of our build system. We also only consume one of the four schema languages the CLI generates. We added an explicit functions list that loads pre-built image tarballs instead of building them, and a schemas block that restricts generation to the languages you actually use (crossplane/cli #24). Now our functions build with the same tooling as everything else, and we generate Python and nothing else.
The DRA-style attribute model then walked us into a chain of three related bugs, all rooted in the same thing: a DeviceAttribute has fields named exactly int, bool, string, and version. Those are Python keywords and builtins, and they broke at every layer. First, schema generation emitted Python models that referenced undefined type aliases and wouldn't import at all (crossplane/cli #64); the fix was to bump the code generator to a version that sanitizes such names and preserves the wire name with a Pydantic alias. With the models importable, serialization was next: the SDK emitted bool_: true under the Python attribute name instead of bool: true under the wire alias, so the API server rejected it. Passing by_alias=True, and switching from exclude_defaults to exclude_unset so we serialize the fields the caller actually set rather than the fields that differ from a default, put both right (function-sdk-python #208, with helpers in #205).
The fleet scheduler also needed something the framework couldn't yet express. It has to reason over every InferenceCluster and every ModelReplica in the control plane, not one resource by name or a set by a label match. A require_resources selector with no match field is the natural way to say "all resources of this kind," and the protobuf allows it, but Crossplane rejected it on both the wire and the SDK side. We taught the reconciler to treat an empty selector as match-all (crossplane/crossplane #7241) and relaxed the SDK's validation to match (function-sdk-python #213). That match-all call is now the first thing the scheduler does every reconcile.
Testing functions this complex surfaced one more. crossplane render reimplements the XR reconciler's composition pipeline, and that parallel copy drifts from the real one, so a function can pass render and behave differently in a real control plane. We added a hidden render engine that runs the actual reconciler against an in-memory client, so tools can test against the real composition pipeline rather than a copy of it (crossplane/crossplane #7280).
Finally there's a one-pager up for function-controlled deletion (#7242), which aims to make ordered deletion of composed resources within one XR easier and more expressive than using Usages.
None of these are glamorous. But that's how a framework gets better: you build something hard on it and fix the friction.
What I took away
I went into Modelplane wanting to know whether you could build something this demanding entirely on Crossplane, without dropping to a hand-written controller when the going got hard. You can, though we had to fix the framework in a few places to get there. It's still compositions and functions any adopter can read and extend.
Modelplane is Apache 2.0 and developed in the open. If you run accelerators of any kind, take a look at modelplane.ai, and if you build hard things on Crossplane, find its edges and help make them better.
Event streaming with Apache Kafka by providing Kubernetes-native Kafka deployments
Replaying the Stream: StrimziCon 2026 Recap and Recordings

StrimziCon is over for another year!
The 2026 program included:
- 6 sessions
- 10 speakers from 5 organizations
- Over 4 hours of content
This year’s content included tips for running in production, best practices for using Strimzi components, and real-world use cases shared by maintainers, contributors and users of Strimzi. In the breaks between sessions attendees connected and shared their own experiences with Strimzi.
A massive thank you to everyone who joined us live on the day, our wonderful speakers, the program committee who built the schedule, and to CNCF for hosting the event.
Session Recordings and Slides
All the session recordings are now available on the Strimzi YouTube channel. To help you choose which one to watch first, here’s an introduction to each session, as well as links to the recording and slides.
Keynote (Recording/Slides)
Speakers: Paolo Patierno & Kate Stanley @ IBM
Paolo and Kate opened the event by sharing the latest features and improvements that have been added to Strimzi over the past year, including the long awaited 1.0.0 release. They also shared some insights into how the 1.0.0 release came about and provided a glimpse into what’s on the horizon for the project. Finally, they shared some updates from the community, including new ways to keep up with the wider community, the new AI policy and the path to graduation.
Beyond the Install: Take full ownership of your Strimzi cluster (Recording/Slides)
Speaker: Jakub Scholz @ Cloudera
Jakub challenged the notion that open source is “free” and explored what it really means to own your Strimzi installation in production. The session covered critical aspects of Strimzi ownership including securing your container supply chain, mirroring images, and handling CVEs in base images and dependencies even when there’s no official patch release.
Who Are You? Configuring Kafka Authentication in Strimzi from TLS to Custom Principals (Recording/Slides)
Speaker: Daniel Mulder @ Axual
Daniel walked through the full range of authentication options available in Strimzi, from basic TLS authentication to advanced custom principal builders. The session explored listener-aware authentication patterns and how to implement a robust multi-tenancy strategy, while also discussing the risks of leaning too heavily on Strimzi internals and how to add authorization into the picture.
Swapping the Engine Mid-Flight: How We Moved Reddit’s Petabyte Scale Kafka Fleet to Kubernetes (Recording/Slides)
Speaker: Sky Kistler @ Reddit
Sky shared Reddit’s remarkable journey of migrating 500+ EC2-backed Kafka brokers and petabytes of data to Strimzi on Kubernetes with zero downtime. The session detailed their innovative “stretch cluster” approach, including DNS facade implementation, hybrid cluster setup by temporarily forking the Strimzi operator, and the step-by-step process that treated the migration as a series of safe, reversible operations rather than a risky “lift and shift.”
Building Strimzi MCP Server for Kubernetes: Democratizing Platform Expertise Through LLMs (Recording/Slides)
Speaker: David Kornel, Jakub Stejskal @ IBM
David and Jakub demonstrated how they built an open-source MCP server for Strimzi that makes platform expertise accessible through natural language interactions with LLMs. The session included a live demo of incident diagnosis, explained the implementation using Quarkus, and discussed how structured data and prompt templates guide the LLM through expert-level troubleshooting steps while catching misconfigurations without requiring extensive documentation reading.
From Running to Operating: Real-World Strimzi in Production (Recording/Slides)
Speakers: Rajith Attapattu @ Randoli
Rajith shared a real-world case study of running Strimzi at scale, covering architecture choices, monitoring insights and how they handled the upgrade to Strimzi 1.0.0. The session explored how to instrument Strimzi with OpenTelemetry, identify signals that actually matter, and build actionable observability, along with operational patterns that help teams move from reactive firefighting to proactive reliability.
Disaster Recovery in action with Kafka and Strimzi (Recording/Slides)
Speaker: Mickael Maison, Gantigmaa Selenge @ IBM
Mickael and Tina walked through the key considerations for setting up and operating a disaster recovery environment for Kafka using Strimzi and MirrorMaker. The session covered monitoring replication lag and health, clean and unclean failover/failback procedures, offset translation semantics, and important limitations and pitfalls to be aware of when implementing disaster recovery.
Closing (Recording/Slides)
Speakers: Paolo Patierno & Kate Stanley @ IBM
Paolo and Kate closed the event by reflecting on the day’s sessions and thanking the speakers, attendees, and everyone who contributed to making StrimziCon 2026 a success. They also posed some final questions to the audience and shared some insights from Strimzi maintainers on their favourite features and what they are looking forward to coming to the project in future.
What Next?
If you’ve run out of StrimziCon 2026 sessions to watch, why not check out our playlist of last year’s event. Find out how you can help the Strimzi community on our Join Us page on the website.
Thanks again to everyone who made this year’s event such a success.
Ultra light, ultra simple, ultra powerful. Linkerd adds security, observability, and reliability to Kubernetes, without the complexity.
Announcing Linkerd 2.20: Rate-limit-aware load balancing, reduced memory usage, better inbound metrics, and more
Linkerd 2.20 is now available! This release improves circuit breaking and load balancing to be aware of rate limit responses, significantly improves memory consumption of the control plane (especially on busy clusters), and improves Linkerd’s metrics suite for inbound traffic. This release also promotes native sidecars to the default deployment type for Linkerd’s data plane microproxies.
Linkerd has now seen almost a decade of continuous improvement and evolution. Our goal is to build
OpenKruise V1.9 Release, API v1beta1, Cron Imagepulling, and More
OpenKruise (https://github.com/openkruise/kruise) is an open-source cloud-native application automation management suite. It is also a current incubating project hosted by the Cloud Native Computing Foundation (CNCF). It is a standard extension component based on Kubernetes that is widely used in production of internet scale company. It also closely follows upstream community standards and adapts to the technical improvement and best practices for internet-scale scenarios.
OpenKruise has released the latest version v1.9.0 on June 21, 2026 (ChangeLog). This release brings API upgrades to v1beta1, Windows node support, and several new features. This article introduces the key features in detail and briefly covers other notable changes.
Upgrade Notice
- Kubernetes dependency has been updated to v1.32.6 and Golang to v1.23. Make sure your cluster is compatible.
- API v1alpha1 → v1beta1: BroadcastJob, AdvancedCronJob, ImagePullJob, ImageListPullJob, NodeImage, Advanced DaemonSet, and SidecarSet APIs have been upgraded from v1alpha1 to v1beta1. The v1alpha1 APIs are still supported but deprecated, and conversion webhooks handle automatic migration transparently. Users are strongly encouraged to update their manifests to v1beta1 before upgrading to OpenKruise v2.0.
In addition to the apiVersion change, several fields were updated during the promotion:
SidecarSet field changes:
spec.namespaceis deprecated — usespec.namespaceSelectorwith thekubernetes.io/metadata.namelabel instead.- The
"apps.kruise.io/sidecarset-custom-version"annotation is replaced by thespec.customVersionfield.
# Before (v1alpha1)
apiVersion: apps.kruise.io/v1alpha1
kind: SidecarSet
metadata:
  annotations:
    apps.kruise.io/sidecarset-custom-version: "v1"
spec:
  namespace: default
# After (v1beta1)
apiVersion: apps.kruise.io/v1beta1
kind: SidecarSet
metadata:
  name: my-sidecarset
spec:
  customVersion: v1
  namespaceSelector:
    matchLabels:
      kubernetes.io/metadata.name: default
Advanced DaemonSet field changes:
- The
"daemonset.kruise.io/progressive-create-pod"annotation is replaced byspec.scaleStrategy. status.DaemonSetHashis replaced bystatus.UpdateRevision.spec.partitiontype changed from*int32to*intstr.IntOrString— now supports percentage values like50%.spec.updateStrategy.rollingUpdate.type: Surgingis deprecated — useStandardinstead.
# After (v1beta1) — partition now supports percentage
apiVersion: apps.kruise.io/v1beta1
kind: AdvancedDaemonSet
spec:
  partition: "50%"
  updateStrategy:
    rollingUpdate:
      type: Standard
For the full list of API promotions and field changes, see the API Upgrade Guide.
Note: The v1alpha1 API for Advanced StatefulSet will be removed in OpenKruise v2.0. Other v1alpha1 APIs have no removal plan yet, but migration is recommended to avoid conversion webhook overhead.
Key Features
UnitedDeployment ReserveUnschedulablePods
In elastic scenarios, you often want to prioritize scheduling Pods on owned node pools (e.g., self-built IDC) and use elastic node pools (e.g., virtual-kubelet) as fallback. The existing Adaptive strategy permanently moves Pods to other subsets when the target subset is unschedulable. However, this means you lose the preferred topology — even after the original subset recovers, the Pods stay where they were moved.
v1.9.0 introduces reserveUnschedulablePods under the Adaptive scheduling strategy. When enabled, unschedulable Pods are reserved in the target subset, and a temporary replica is created in the next available subset to maintain the expected replica count. Once the target subset becomes schedulable again, the temporary replica is deleted and the reserved Pod is scheduled back to the original subset.
apiVersion: apps.kruise.io/v1alpha1
kind: UnitedDeployment
metadata:
  name: sample-ud
spec:
  topology:
    scheduleStrategy:
      type: Adaptive
      adaptive:
        reserveUnschedulablePods: true
        rescheduleCriticalSeconds: 30
    subsets:
      - name: ecs
        nodeSelectorTerm:
          matchExpressions:
            - key: node-type
              operator: In
              values: [ecs]
      - name: vk
        nodeSelectorTerm:
          matchExpressions:
            - key: node-type
              operator: In
              values: [virtual-kubelet]
In this example, Pods are prioritized on ECS nodes. When ECS nodes are full, temporary replicas are created on virtual-kubelet nodes. Once ECS capacity is restored (e.g., after node scaling), the temporary replicas are removed and Pods migrate back to ECS.
Limitation: Only works with the Adaptive scheduling strategy. The temporary replica creation is recursive across subsets.
AdvancedCronJob Cron ImagePullJob
For AI/ML workloads that use large images (e.g., several GB), pre-pulling images before Pod scheduling significantly reduces startup time. In large model workload clusters, nodes frequently garbage-collect (GC) images due to disk space pressure, so pre-warming needs to be re-run before scheduled tasks to ensure effectiveness. Previously, you had to manually create ImagePullJob resources or use external cron tools. Now you can schedule image pre-pulling as a cron task directly within AdvancedCronJob using the new imageListPullJobTemplate field.
apiVersion: apps.kruise.io/v1beta1
kind: AdvancedCronJob
metadata:
  name: acj-image-pull
spec:
  schedule: "0 */2 * * *"
  concurrencyPolicy: Replace
  template:
    imageListPullJobTemplate:
      spec:
        parallelism: 5
        images:
        - nginx:1.14.2
        - busybox:latest
        pullSecrets:
        - default-secret
        selector:
          names:
          - node1
          - node2
        pullPolicy:
          timeoutSeconds: 60
        imagePullPolicy: IfNotPresent
This example creates an ImageListPullJob every 2 hours, pulling the specified images on node1 and node2. The concurrencyPolicy: Replace ensures that if a new job is triggered while the previous one is still running, the old one is replaced.
Limitation: Uses the v1beta1 API. The imageListPullJobTemplate field is available since v1.9.0.
CloneSet progressDeadlineSeconds
In CI/CD pipelines, it is important to detect rollout failures early. Without a progress deadline, a stuck rollout (e.g., image pull errors, readiness probe failures) can hang indefinitely without any signal. v1.9.0 adds progressDeadlineSeconds to CloneSet, similar to the native Kubernetes Deployment field.
apiVersion: apps.kruise.io/v1beta1
kind: CloneSet
spec:
  replicas: 10
  progressDeadlineSeconds: 600
  # ...
If the rollout does not progress within 600 seconds, the CloneSet controller adds the following condition to .status.conditions:
type: Progressing
status: "False"
reason: ProgressDeadlineExceeded
Higher-level orchestration systems (e.g., ArgoCD, Flux) can watch this condition to trigger automatic rollbacks.
Limitation: The value must be greater than spec.minReadySeconds. This condition does not stop the underlying rollout — it only signals the failure. Pausing the rollout also pauses the deadline check.
SidecarSet Dynamic Resources
Sidecar containers (e.g., service mesh proxies, log agents) often need resources proportional to the main container. Previously, you had to set fixed resource requests/limits for sidecars, which led to either over-provisioning for small Pods or under-provisioning for large Pods.
v1.9.0 introduces resourcesPolicy, which lets you define sidecar resources as expressions based on the target Pod's container resources.
apiVersion: apps.kruise.io/v1beta1
kind: SidecarSet
spec:
  containers:
  - name: sidecar1
    image: centos:6.7
    resourcesPolicy:
      targetContainersMode: sum
      targetContainersNameRegex: ^large-engine-v4$
      resourcesExpr:
        limits:
          cpu: max(cpu*50%, 50m)
          memory: 200Mi
        requests:
          cpu: max(cpu*50%, 50m)
          memory: 100Mi
In this example, the sidecar's CPU is set to 50% of the large-engine-v4 container's CPU, with a minimum of 50m. Supported expression operators include +, -, *, /, max(), min(), and Kubernetes resource quantities (e.g., 50m, 200Mi).
Limitation: The cpu and memory variables in the expression represent the aggregated resource values from target containers, calculated based on targetContainersMode (e.g., sum) and targetContainersNameRegex.
PodUnavailableBudget RESIZE Protection
PodUnavailableBudget (PUB) protects application availability by limiting how many Pods can be unavailable simultaneously. Previously, PUB protected against DELETE, EVICT, and UPDATE operations. With the growing adoption of in-place vertical scaling (Kubernetes 1.27+ InPlacePodVerticalScaling), RESIZE operations can also make Pods temporarily unavailable.
v1.9.0 adds RESIZE as a protected operation. You can control which operations are protected via an annotation:
apiVersion: policy.kruise.io/v1alpha1
kind: PodUnavailableBudget
metadata:
  name: web-server-pub
  annotations:
    # By default: DELETE, EVICT, UPDATE are protected
    # Add RESIZE to also protect in-place resource resizing
    kruise.io/pub-protect-operations: "DELETE, EVICT, UPDATE, RESIZE"
spec:
  targetRef:
    apiVersion: apps.kruise.io/v1beta1
    kind: CloneSet
    name: web-server
  maxUnavailable: 20%
Limitation: If the InPlacePodVerticalScaling feature gate is disabled, in-place resizing is treated as an UPDATE operation instead.
Other Notable Changes
The following features were also introduced in v1.9.0 — see the documentation for details:
- SidecarSet shareVolumeDevicePolicy: Sidecar containers can now share block devices (VolumeDevices) with other containers in the Pod, analogous to the existing
shareVolumePolicyfor volume mounts. - SidecarSet injection order: SidecarSet now sorts
containersandinitContainersby name in ascending order during injection, ensuring deterministic ordering for sidecars with dependencies. - PodProbeMarker HTTP probe: Supports
httpGetprobes in addition toexecandtcpSocket, enabling direct HTTP health checks without wrappingcurlin exec. - CloneSet OnDelete strategy: A new
podUpdatePolicytype where Pods are only updated when manually deleted — useful for stateful workloads requiring manual update control. - JobSidecarTerminator exit code control: The
KRUISE_TERMINATE_SIDECAR_IGNORE_EXIT_CODEenv var lets you explicitly control whether a sidecar's non-zero exit code affects Pod Phase. - ImagePullJob node-side concurrency: The
--max-concurrencyflag on kruise-daemon limits concurrent image pulls per node, preventing resource exhaustion. - OpenKruise Daemon Windows support: kruise-daemon now runs on Windows nodes, enabling CRR, image pre-pulling, and PodProbeMarker for Windows workloads.
Other Improvements
Various bug fixes and stability improvements are included in this release. For the full list, see the changelog.
What's Next in v2.0
Looking ahead, the next major release (v2.0) will bring two significant changes:
More API upgrades to v1beta1: CloneSet, WorkloadSpread, UnitedDeployment, PersistentPodState, PodUnavailableBudget, PodProbeMarker, and NodePodProbe will be promoted from v1alpha1 to v1beta1. Additionally, the v1alpha1 API for Advanced StatefulSet will be removed in v2.0.
ConfigMapSet — a new configuration canary release feature: ConfigMapSet is a new CRD currently under active development on the master branch. It enables zero-downtime configuration updates decoupled from image releases — you can update configuration data (e.g., YAML files, environment variables) and roll it out gradually without rebuilding images. Key capabilities include:
- Version management: Maintains a revision history of configuration versions, allowing rollback to previous versions.
- Configuration canary: Uses
partitioninupdateStrategyto control the rollout percentage, enabling gradual configuration updates. - Container selection: Supports both static container names and dynamic selection via field references (compatible with SidecarSet injection).
- Update strategies: Two modes — injection-only (default) where the reload sidecar updates configs without restarting containers, and
restartInjectedContainersmode where containers using the configuration are also restarted.
apiVersion: apps.kruise.io/v1alpha1
kind: ConfigMapSet
metadata:
  name: deploy-cms
spec:
  selector:
    matchLabels:
      app: sample
  data:
    settings.yaml: |
      value: aaa
  containers:
  - name: main
    mountPath: /data/conf
  revisionHistoryLimit: 5
  updateStrategy:
    partition: 10%
    restartInjectedContainers: true
    maxUnavailable: 1
Note: ConfigMapSet is still under active development. The API and feature set may change before the official release.
Get Involved
Welcome to get involved with OpenKruise by joining us in Github/Slack/DingTalk/WeChat. Have something you'd like to broadcast to our community? Share your voice at our Bi-weekly community meeting (Chinese), or through the channels below:
- Join the community on Slack (English).
- Join the community on DingTalk: Search GroupID
23330762(Chinese). - Join the community on WeChat (new): Search User
openkruiseand let the robot invite you (Chinese).
Keycloak is an open-source identity and access management solution for modern applications and services, built on top of industry security standard protocols.
Meet Keycloak at KubeCon Japan in July
The Keycloak project is back at KubeCon Japan Yokohama with all highlights: Talks, our kiosk in the Project Table, and this time also with KeycloakCon, our very-own co-located event! If you are new to Keycloak, or already a user, join us for this exciting event to learn and connect.
Enabling built-in observability for cloud-native systems.
Deprecating OpenCensus compatibility requirements
On June 12, 2026, the OpenTelemetry Specification project merged PR #5138, deprecating OpenCensus compatibility requirements in the specification.
This change updates the specification to match where the ecosystem already is: OpenCensus has been archived since July 31, 2023, and
Kubernetes-native tools to run workflows, manage clusters, and do GitOps right.
Argo CD v3.5 Release Candidate

The Argo CD community is thrilled to announce Argo CD 3.5! This release brings significant improvements across authentication, ApplicationSets, Helm support, security, and platform reliability.
We’re excited to highlight improvements such as a new ApplicationSet UI with built-in change previews, impersonation workflows, Helm 4 support, mTLS support for repo-server, and critical bug fixes that strengthen the platform. We encourage the community to test the release candidate and share feedback before the final release.
This release represents months of collaborative work by the Argo CD community, with contributions that address long-standing feature requests and improve the operational experience for teams managing deployments at scale.
Impersonation Moves to Beta
Impersonation — the ability for Argo CD to assume a different user identity when performing operations — is now promoted from alpha to beta. This feature is critical for multi-tenant environments where operations such as viewing logs, deleting resources, and syncing applications should be performed with specific user permissions.
Improved User Impersonation for Operations
Server-side operations like viewing logs, deleting resources, and syncing applications now respect user impersonation settings. This ensures that actions execute with the correct user context, critical for audit logging and multi-tenant security.
How to use it: Impersonation is now applied automatically to all server operations when configured in your AppProject or RBAC policy.
Thanks to @alexymantha (GoTo) for implementing impersonation in server operations.
Source Hydrator Advances to Beta
The Source Hydrator feature is now promoted from alpha to beta. This release brings significant enhancements to the hydration workflow:
Separate Repositories for Dry and Hydrated Manifests
Configure separate repositories for dry (unhydrated) and hydrated manifests to enable advanced multi-repository GitOps patterns. This allows your source dry manifests to live in one repository while the hydrated output is stored in another.
How to use it: Set distinct repositories in your hydrator configuration:
sourceHydrator:
  drySource:
    repoURL: https://github.com/your-org/dry-manifests
  syncSource:
    repoURL: https://github.com/your-org/hydrated-output
Source Integrity Checking on Dry Commits
Verify the authenticity and integrity of dry source commits before hydration. This ensures that only signed, trusted dry manifests are hydrated and deployed to your clusters.
How to use it: Enable source integrity requirements on your dry source to prevent unauthorized manifest changes from being hydrated.
Thanks to @boostrack (Boostrack Inc.) for the dry-source repository support and for advancing the Source Hydrator to beta stability.
ApplicationSet Stability and Features
ApplicationSet native support in Argo CD UI
You can now list, filter, view details, and visualize ApplicationSet-generated preview applications directly in the UI. The new Preview Apps tab shows which applications will be created from your ApplicationSet templates before they’re deployed.
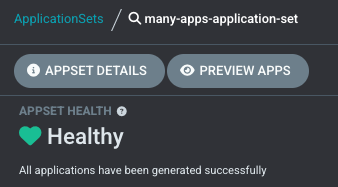
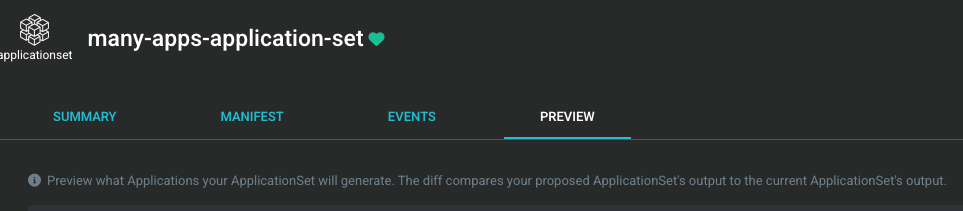
How to use it: Read the detailed blog post about the new ApplicationSet UI.
Thanks to @pjiang-dev (Intuit), @keithchong (RedHat), @alexymantha (GoTo), and @reggie-k (Octopus Deploy) for building this UI enhancement.
ApplicationSet in Any Namespace
ApplicationSets are now fully stable and can be deployed in any namespace, not just the Argo CD namespace. This enables multi-team GitOps workflows where different teams manage their own ApplicationSets independently.
Thanks to @Mangaal (Red Hat) for stabilizing this widely-requested feature.
ApplicationSet Concurrency Control
Manage the concurrency of ApplicationSet operations to prevent overwhelming your cluster or Git repository with simultaneous requests. This is especially valuable for teams managing hundreds of applications.
How to use it: Configure concurrency limits in your ApplicationSet spec to control how many applications are processed in parallel.
Thanks to @rumstead (BlackRock) for adding concurrency controls.
ApplicationSet Proxy URL as Native Flag
The --proxy-url parameter for ApplicationSet operations is now a native flag, providing better integration with Argo CD's standard CLI patterns.
Thanks to @ppapapetrou76 (Octopus Deploy) for this improvement.
Helm 4 Support
Argo CD now supports Helm 4, allowing teams to leverage the latest Helm features and improvements. This upgrade ensures compatibility with the newest Helm toolchain while maintaining backward compatibility with existing Helm 3 deployments.
Thanks to @reggie-k (Octopus Deploy) for implementing Helm 4 support.
mTLS Support for Repo-Server
Secure all communications between repo-server and other Argo CD components (API server, application controller, appset controller) using mutual TLS (mTLS). This adds an extra layer of encryption and authentication for internal component communication.
How to use it: Configure client certificates for each component communicating with the repo-server. Repo-server also automatically generates self-signed certificates in-memory for internal health checks if custom certificates aren’t provided, eliminating the need for file system access. For a full operation guide, check the official docs.
Thanks to @ppapapetrou76 (Octopus Deploy) for implementing mTLS support for secure internal communication.
Source Integrity Validation
Enforce Source Integrity for Supply Chain Security
Source Integrity allows you to verify that Git sources have been signed and that signatures validate before syncing. This provides defense-in-depth against supply chain attacks and ensures only trusted code is deployed.
How to use it: Configure signature requirements in your Application spec:
source:
  repoURL: https://github.com/your-org/your-repo.git
  sourceIntegrity:
    required: true
    signingKey:
      keyId: "your-key-id"
Thanks to @olivergondza (Red Hat) for implementing source integrity validation.
Configure Source Integrity from CLI
Source Integrity can now be configured using the argocd app and argocd appset CLI commands to streamline configuration for teams that prefer CLI workflows.
Example:
argocd app set my-app --source-integrity-required --source-integrity-signing-key-id <key-id>
Thanks to @olivergondza (Red Hat) for adding CLI support for source integrity configuration.
Other notable additions
Azure AD Groups Claims Overflow via Microsoft Graph API
Handle overflow of Azure AD group claims by querying Microsoft Graph API directly. Environments with users across many Azure AD groups can now authenticate successfully without hitting claim size limits.
How to use it: Configure the new groupsClaim setting in your OIDC provider configuration to use Microsoft Graph API for group resolution.
Thanks to @gravufo (Genetec) for implementing Graph API integration.
Azure Service Principal Authentication for Azure DevOps
Deploy applications from Azure DevOps repositories using Azure Service Principal authentication. This eliminates the need for personal access tokens and integrates seamlessly with Azure identity management.
How to use it: Configure your Azure DevOps repository credentials to use Service Principal authentication in the Argo CD UI or via the API.
Thanks to @allanyung for adding Service Principal support.
Network View Gateway API Support
Applications using Kubernetes Gateway API for ingress are now displayed correctly in the network topology view. This provides visibility into traffic routing for modern Kubernetes networking patterns.
How to use it: Deploy applications with Gateway API resources and view their traffic topology in the UI.
Thanks to @tete17 for implementing Gateway API visualization.
Enhanced CLI Namespace Support
The --app-namespace flag is now available across all argocd app subcommands, improving consistency and making it easier to work with applications in non-default namespaces.
How to use it:
argocd app list --app-namespace my-namespace
argocd app get my-app --app-namespace my-namespace
Thanks to @Mangaal (Red Hat) for expanding namespace support.
Search Applications by Target Revision
Quickly filter and locate applications by their deployment target revision directly from the UI. This enhancement makes it easier to find which applications are synced to specific Git commits, branches, or tags.

How to use it: Use the new revision filter in the Applications list to search by branch, tag, or commit SHA.
Thanks to @choejwoo (Hyundai Autoever) for this improvement.
Notable Bug Fixes
This release addresses critical issues affecting reliability, performance, and user experience:
- Kubernetes Resource Size Limits (@nitishfy — Akuity): Gracefully handle Kubernetes’ etcd limit on individual resource sizes when storing large Application objects.
- kubectl Compatibility (@mfacenet): Replace deprecated kubectl functions for pod requests and limits calculation.
- Multi-Source Applications (@reggie-k — Octopus Deploy): Fix GetRefSources to correctly populate sources for multi-source applications with a single source.
- Application Filtering (@choejwoo — Hyundai Autoever): Include deleting and terminated applications in the Syncing operation filter for better visibility.
- Auto-Sync UI (@shiiyan): Improved auto-sync toggling by removing it from the application top bar to reduce accidental configuration changes, while adding an RBAC-controlled toggle to the app details page that can be granted via fine-grained resource action permissions instead of requiring broad update access.
- GnuPG Key Handling (@olivergondza — Red Hat): Fix mangling of GnuPG key names containing unicode characters.
- Long Branch Names (@choejwoo — Hyundai Autoever): Add truncation and tooltips for long sync status branch names in the UI.
- Resource Cleanup (@alexmt — Akuity): Cancel log stream goroutines when clients disconnect to prevent resource leaks.
- Observability Improvements (@nitishfy — Akuity): Fix log format and document intentional shard-0 fallback behavior for better debugging.
- Hydrator Error Messages (@nitishfy — Akuity): Improve error messaging when a hydrator’s sync path doesn’t exist yet.
- Bitbucket Integration (@Mangaal — Red Hat): Fix webhook diffstat parsing for repositories with uppercase slugs.
- Cache Efficiency (@cp319391): Reduce log noise by downgrading DiffFromCache log level for cache misses.
- Hydrator Race Conditions (@agaudreault — Intuit): Fix race condition in hydrator status updates during annotation-based hydration.
- Hydrator Cache Alignment (@agaudreault — Intuit): Align dry source validation cache keys with hydrator for consistency.
- Hydrator Timeout Handling (@boostrack — Boostrack Inc.): Properly requeue source hydration on periodic refresh timeout.
Documentation Improvements
This release includes several documentation updates to help users understand new features and operational best practices:
- Memory Tuning with GOMEMLIMIT (@Julian-Chu): New guidance on optimizing Argo CD memory usage with Go’s memory limit settings, helpful for resource-constrained environments.
- Sync Waves and Pruning (@revitalbarletz — Codefresh): Clarified documentation on prune ordering when using sync waves, reducing confusion around resource deletion order.
- Helm Hook Delete Policy (@Vedant-Mhatre — ByteDance): Improved documentation clarifying Helm hook delete-policy semantics for better hook lifecycle management.
- Orphaned Resources FAQ (@kovan): New FAQ entry addressing common questions about orphaned resources and garbage collection behavior.
- Sync Waves Migration Guide (@choejwoo — Hyundai Autoever): Updated documentation replacing deprecated resource_hooks references with the modern sync-waves approach.=
Where Can I Get the New Release?
For installation instructions and the full changelog, check out the release notes.
We’d love to hear your feedback! Find us on the #argo-cd channel in CNCF Slack to share your experience, report issues, or just say hi.
Thank You
A huge thanks to all Argo CD community contributors and users for their contributions, feedback, and help in testing the release!
Argo CD v3.5 Release Candidate was originally published in Argo Project on Medium, where people are continuing the conversation by highlighting and responding to this story.
Kubernetes is an open-source system for automating deployment, scaling, and management of containerized applications
Spotlight on SIG Storage
In our ongoing SIG Spotlight series, we shine a light on the groups that keep the Kubernetes project moving forward. This time, we catch up with SIG Storage, the group responsible for persistent data, volume management, and the interfaces that connect Kubernetes workloads to the storage systems beneath them.
We spoke with Xing Yang, Co-Chair of SIG S
Cilium is a networking, observability, and security platform based on eBPF. As a CNI, it provides a flat Layer 3 network, even across clusters....
Multi-Cluster Kubernetes Explained
As enterprises scale their cloud native infrastructure, a single Kubernetes cluster often becomes not enough for meeting requirements…
Harbor is an open source registry that secures artifacts with policies and role-based access control, ensures images are scanned and free from vulnerabilities, and signs images as trusted. Can be installed on any Kubernetes environment or on a system with Docker support.
Project Harbor at Open Source Summit India and KubeCon + CloudNativeCon India 2026
Project Harbor at Open Source Summit India and KubeCon + CloudNativeCon India 2026 The Harbor community is excited to be part of both Open Source Summit India 2026 and KubeCon + CloudNativeCon India 2026 in Mumbai. If you are attending either event, this is a great opportunity to meet Harbor contributors, talk about the project roadmap, and learn how Harbor is evolving for modern cloud-native artifact management and software supply chain security.
Enabling built-in observability for cloud-native systems.
OTel-Arrow Phase 2: From Efficient Transport to Efficient Telemetry Pipelines
Phase 1 of OTel-Arrow established OTAP, the OpenTelemetry Arrow Protocol, as an efficient transport protocol for OpenTelemetry. Apache Arrow is a language-independent, columnar in-memory format designed to move and process structured data efficiently across systems. We demonstrated that telemetry could be transpor