Standardized Distributed Generative and Predictive AI Inference Platform for Scalable, Multi-Framework Deployment on Kubernetes
Enterprises today seek to integrate generative AI (GenAI) capabilities into their applications. However, scaling large AI models introduces complexity: managing high-volume traffic from large language models (LLMs), optimizing inference performance, maintaining predictable latency, and controlling infrastructure costs.
Platform engineering leaders require more than just model deployment capabilities. They need a robust, Kubernetes-native infrastructure that supports:
- Efficient GPU utilization
- Intelligent request routing
- Distributed inference patterns
- Cost-aware autoscaling
- Production-grade governance
This article demonstrates how two open-source solutions, KServe and llm-d, can be combined to address these challenges.
We explore the role of each solution, illustrate their integration architecture, and provide practical guidance for AI platform teams, with deeper focus on KServe's LLMInferenceService, available since KServe v0.16.
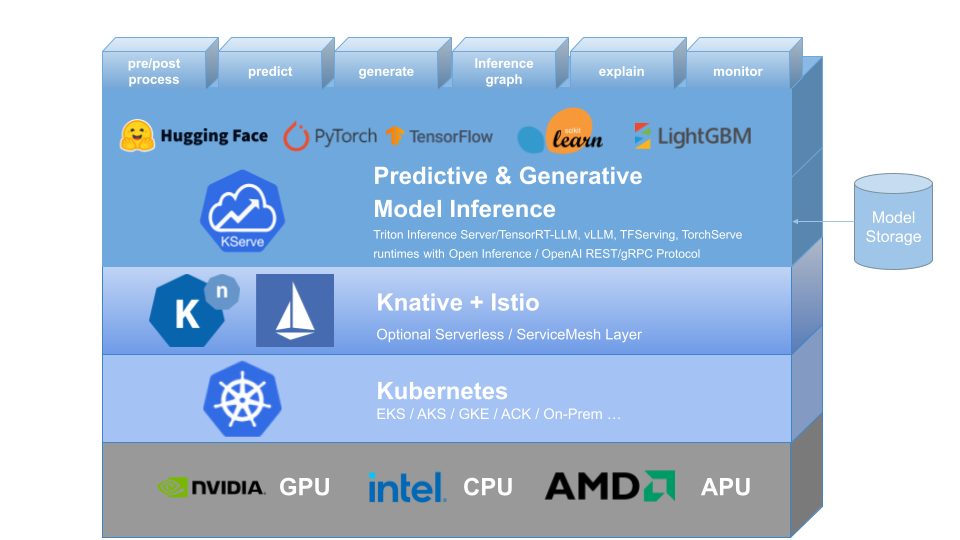
KServe: Simplified Deployment of AI Models on Kubernetes
KServe is a Kubernetes-based model serving platform that simplifies deploying and managing ML models, including LLMs, at scale.
For platform engineers, KServe acts as the model serving control plane: the layer responsible for lifecycle, scaling, and operational governance.
Inference as a Service
InferenceService serves as KServe's core abstraction for model deployment, encapsulating the full serving lifecycle, including:
- Automatic deployment creation and reconciliation
- Request-based autoscaling with scale-to-zero and autoscaling based on custom metrics
- Revision management and canary rollouts
- Endpoint exposure and traffic routing
- Runtime abstraction across serving backends for both predictive and generative AI
- Optional pre-processing/post-processing, inference pipelines, and ensembles
ML engineers provide trained models. Platform engineers retain operational control without writing custom deployment code.
LLMInferenceService in KServe
KServe v0.16 introduces stronger generative AI capabilities, including LLMInferenceService, designed specifically for large language model workloads.
Unlike traditional stateless predictors, LLM workloads require:
- Long-running streaming responses
- GPU-heavy memory footprints
- Prefix KV-cache management
- High-concurrency token streaming
- OpenAI-compatible APIs
LLMInferenceService shares common foundations with InferenceService but introduces additional capabilities tailored for large language models, including:
Unlocking Generative AI Serving with LLMInferenceService: From Pod-Level Speed to Cluster-Wide Intelligence
Imagine you want to bring the power of generative AI directly into your applications, but without rewriting your entire stack. It offers OpenAI-compatible endpoints like /v1/chat/completions, complete with streaming token responses and multi-turn support. With prompt templating built in, developers can integrate seamlessly with existing tools—whether it's the OpenAI SDKs, LangChain, LlamaIndex, Llama Stack, RAG frameworks, or even enterprise GenAI gateways.
Under the hood, KServe connects to LLM-optimized runtimes such as vLLM, Hugging Face TGI, or other GPU-native backends. These engines bring advanced capabilities like continuous batching, memory-efficient paged attention, and KV-cache reuse, delivering high throughput per GPU.
Yet, while these runtime-level optimizations make each pod lightning fast, true cluster-wide efficiency needs more. That's exactly the role of llm-d: adding an extra layer of intelligence that orchestrates resources and maximizes performance across the entire deployment.
Distributed & Multi-Node Model Support
LLMInferenceService supports advanced parallelism strategies implemented by runtimes, including tensor parallelism, pipeline parallelism, and multi-GPU sharding.
This enables hosting 70B+ parameter models, partitioning models across nodes, and serving models larger than single-GPU memory.
KServe orchestrates the deployment topology, while the runtime manages execution parallelism.
Advanced Autoscaling & Networking (Including Scale-to-Zero)
KServe integrates deeply with Kubernetes to support request- and concurrency-based autoscaling via Knative, GPU-backed scaling, and scale-to-zero for cost control.
It also integrates with the Kubernetes Gateway API for TLS termination, traffic splitting, and advanced routing.
This makes it suitable for development environments, internal copilots, and large-scale production workloads.
Kubernetes Gateway API Integration
KServe integrates with Kubernetes Gateway API for:
- Enterprise-grade routing
- TLS termination
- Traffic splitting
- Multi-model routing
This enables integration with modern Kubernetes networking stacks.
Where KServe Alone Is Not Enough
Even with LLMInferenceService and optimized runtimes, KServe does not inherently:
- Route requests based on KV-cache locality across replicas
- Separate prefill and decode cluster-wide
- Perform SLA-aware routing decisions
- Optimize GPU utilization across multiple pods
To address these, we introduce llm-d.
llm-d: Distributed Intelligence for LLM Inference
llm-d is a Kubernetes-native distributed inference framework designed to enhance performance and efficiency of LLM workloads.
If KServe is the control plane for models, llm-d is the distributed intelligence scheduling layer.

KV-Cache Aware Scheduling and Disaggregated Inference with llm-d
As LLM deployments mature, scaling is no longer just about adding GPUs. It's about using them intelligently. Modern runtimes such as vLLM introduced prefix (KV) caching to reduce redundant computation, but without smart scheduling, much of that benefit is lost.
This is where llm-d changes the game.
Disaggregated Inference (Prefill / Decode Separation)
LLM inference consists of two distinct phases: prefill and decode. The prefill phase is compute-heavy, processing the full prompt and building the model's attention context. The decode phase is latency-sensitive, generating tokens step by step where responsiveness directly impacts user experience.
llm-d separates these phases across different GPU groups, assigning compute-optimized resources to prefill and latency-optimized resources to decode. With intelligent scheduling between them, workloads are aligned to the right hardware profile.
This phase-aware architecture increases GPU utilization, reduces tail latency, and lowers cost per token by eliminating resource contention between fundamentally different workloads.
Intelligent Inference Scheduler
llm-d's inference scheduler evaluates the following metrics:
- GPU utilization
- Queue depth
- Cache residency
- SLA constraints
- Load distribution
It enhances load balancing with an intelligent scheduler to decrease serving latency and increase throughput with prefix-cache aware routing, utilization-based load balancing, fairness and prioritization for multi-tenant serving, and predicted latency balancing.
KServe LLMInferenceService and llm-d
Responsibility Separation
This layered design ensures composability and specialization, providing a complete, production-ready solution for generative AI. KServe acts as the control plane and LLMInferenceService delivers the generative API abstraction, while llm-d provides the cluster-wide optimization.
| Layer | Responsibility |
|---|
| KServe | Model lifecycle, scaling, governance |
| LLMInferenceService | Generative API abstraction |
| vLLM | Efficient execution inside runtime |
| llm-d | Cross-runtime routing & cache awareness |
| Kubernetes | Resource orchestration |
Together, KServe and llm-d enable a production-ready, Kubernetes-native inference platform that balances scalability, performance, and cost efficiency, providing the best of both worlds for cloud-native AI inference at scale.
Cost Efficiency Comparison: Naive vs Optimized
Serving LLMs at scale is no longer just a model problem. It is a distributed systems problem where naive load balancing leads to significant inefficiencies and wasted resources — lost cache locality, GPU imbalance, redundant prefill processing, high tail latency, and overprovisioned GPUs.
Naive Problems:
- Cache locality loss
- GPU imbalance
- Redundant prefill processing
- High tail latency
- Overprovisioned GPUs
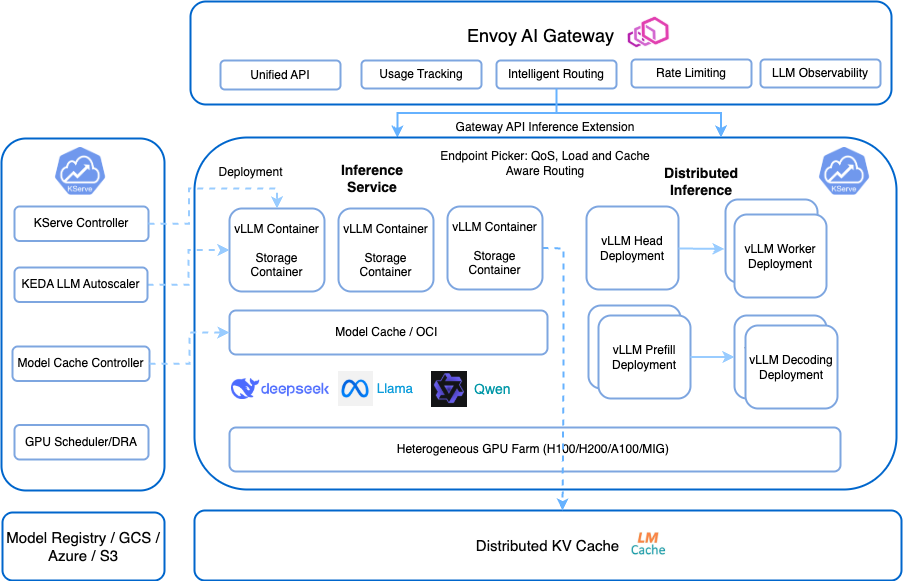
Optimized Architecture with KServe + llm-d
The combined KServe and llm-d solution introduces distributed intelligence to solve the problems of naive architectures, delivering superior performance, scalability, and cost control. This optimized architecture is pluggable and extensible to work well with many AI and cloud-native technologies.
Benefits:
- Cache reuse preserved
- Balanced GPU utilization
- Reduced recomputation
- Lower cost per token
- Controlled autoscaling via LLMInferenceService
Benchmark Results: Why Cluster-Level Intelligence Matters
By integrating llm-d's cache-aware routing, prefill and decode disaggregation, and SLA-based scheduling with KServe's enterprise-grade generative serving and autoscaling, the system achieves cluster-wide GPU optimization.
Note: The following results are based on benchmarks published by the llm-d project
| Optimization Area | Naive Architecture (Round Robin LB) | Optimized (KServe + llm-d) | Source |
|---|
| Cache Locality | Requests routed randomly → KV cache frequently missed | Cache-aware routing preserves prefix locality | llm-d blog |
| Time to First Token (P90) | Baseline latency under cache-blind scheduling | Up to ~57× faster P90 TTFT in benchmark | llm-d blog |
| Token Throughput | ~4,400 tokens/sec (baseline test cluster) | ~8,730 tokens/sec (~2× improvement) | llm-d blog |
| Throughput at Scale | Degrades under multi-tenant load | Sustained 4.5k–11k tokens/sec | llm-d blog |
| Tail Latency (P95/P99) | Higher tail latency due to stragglers & imbalance | ~50% tail latency reduction (reported tests) | Red Hat Developers |
| GPU Utilization | Uneven utilization, idle GPUs possible | Improved effective utilization via routing intelligence | llm-d docs |
| Autoscaling Control | Scale reacts to load only | Works with KServe autoscaling + routing intelligence | KServe docs |
Modern GenAI platforms require cache locality awareness, phase-aware scheduling, distributed intelligence, and composable Kubernetes-native design. This combination ensures a production-ready system that meets the demands of large-scale production workloads.
Next Steps
Explore detailed project documentation:
Engage with community resources and Slack channels to stay updated and contribute to ongoing developments:

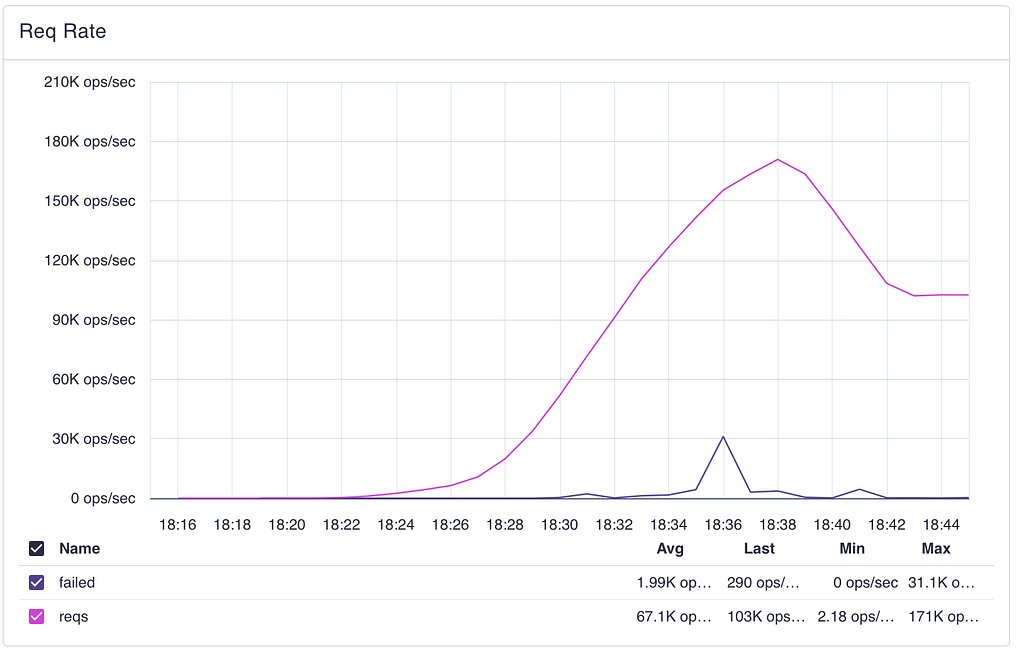 Request rate ramp: successful requests (pink) peak at 171K ops/sec before the test exits. Failed requests (blue) spike briefly near saturation.
 Client-side latency (k6): flat near zero through moderate load, stepping up as the cluster approaches saturation, and reaching 1.5s+ at the breaking point.
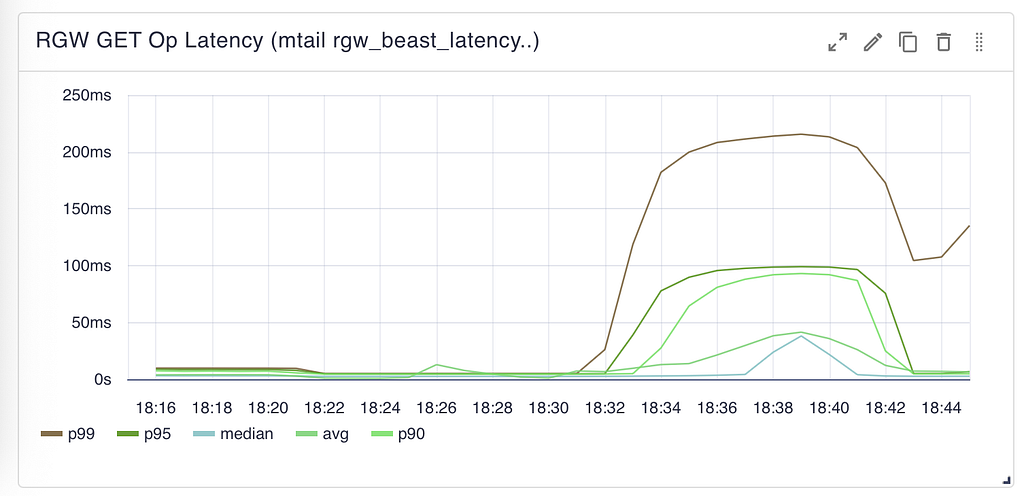 RGW-side GET latency: all percentiles stay flat and sub-ms through moderate load. Around 90K GET/s, p99 begins climbing while median remains low — a classic saturation signal.
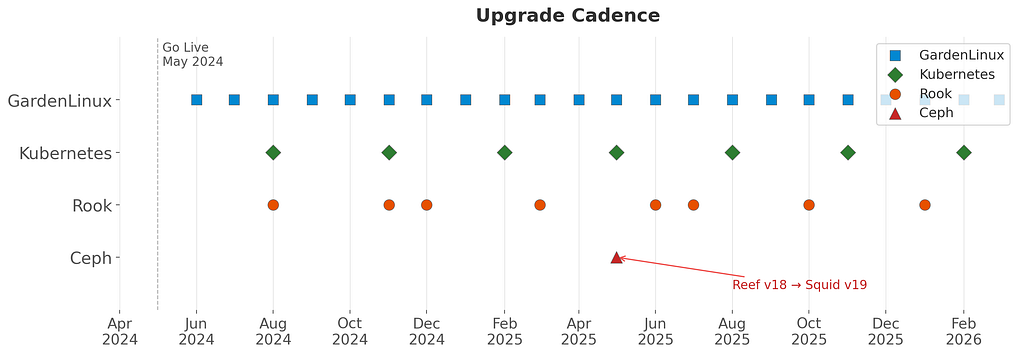 Upgrade cadence since May 2024: GardenLinux monthly, Kubernetes quarterly, Rook quarterly (with extra upgrades for needed features), and one Ceph major version migration.